Auto Insurance Claims Model Validation
Overview
This project builds and validates the kind of frequency and severity models insurers use for pricing. It runs on 678,013 real French motor third-party liability policies (freMTPL2). Raw tables are loaded and cleaned in SQL, features are engineered in Python, and an optional R script cross-checks the cleaning step. A local dashboard shows the results and a 10-slide summary written for a non-technical audience.
Frequency and severity
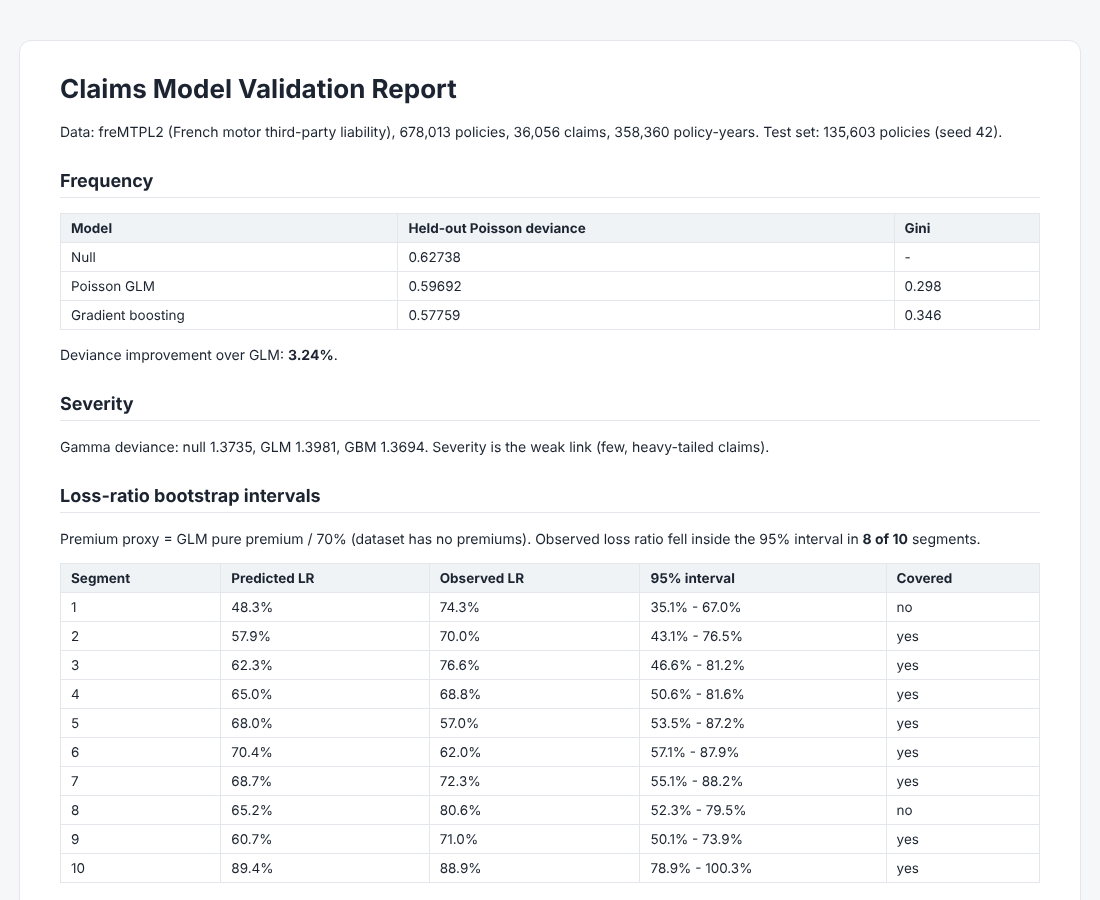
A Poisson GLM is the baseline. A gradient-boosted frequency model with engineered driver, vehicle and region features improves held-out Poisson deviance by 3.2% over the GLM and lifts the Gini from 0.298 to 0.346. Severity uses a Gamma model on claim-level averages, capped at 100,000, and it is the weak link because claims are few and heavy-tailed.
Validating the models
- Lift charts and calibration plots on a held-out 20% of policies
- Bootstrap loss-ratio intervals: 95% intervals covered the observed loss ratio in 8 of 10 policy segments
- Slice analysis: actual versus expected claims for young and old drivers, high bonus-malus, dense urban areas, old vehicles and the top 5% of predicted risk
Honest limits
The dataset has no premium column, so loss ratios use a proxy premium (the GLM pure premium divided by 70%). Only about 74% of recorded claims carry an amount, so severity is rescaled to match actual losses. The data is a single snapshot with no drift testing, and sparse high-risk slices are noisy. The generated report lists all of these.
Stack
Python · R · SQL (SQLite) · Pandas · scikit-learn · Git